Explore this Twitter Sentiment Analysis on my Github repository and read the related Publication
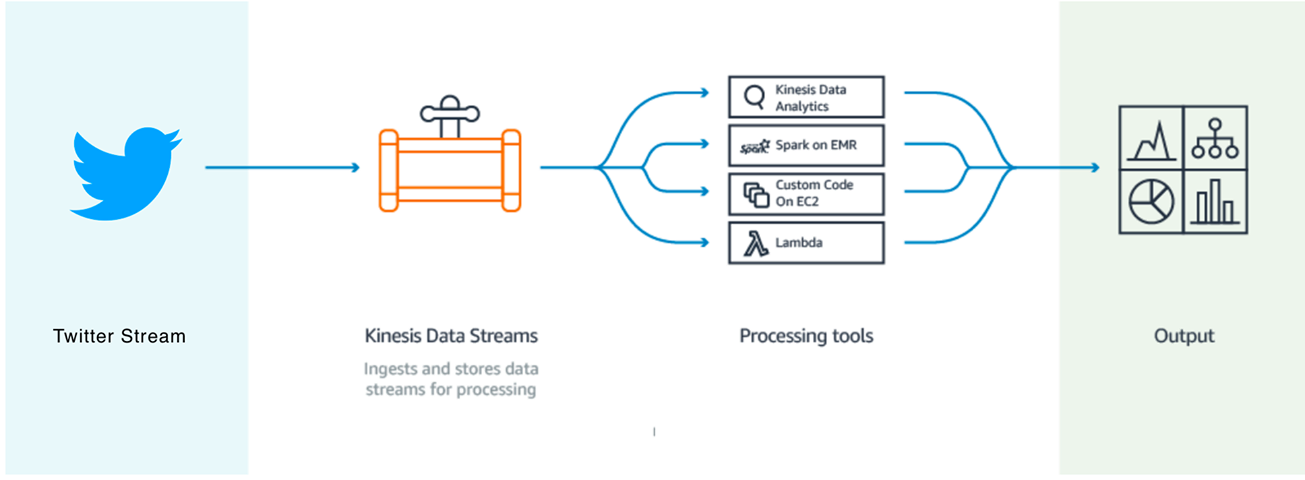
Key Technologies Used
- Scikit-learn
- Spark
- AWS EMR, S3, Lambda, Kinesis, API Gateway
- MQTT
- React JS
- RDS (Postgres SQL)
The Goal
The main goal is to build a platform for real-time tweet analysis that focuses on current trends. We also want to analyze all tweets from 2017 using a data sample of about 6TB on average. The analysis results will be available through a web interface.
We aim to create a meaningful database structure of tweets to support sentiment analysis and reveal impact and effects. The system should make it easier to apply Machine Learning methods to data from Twitter. By analyzing trending news through real-time data streams and creating a web interface, we can easily access results and keep controlling the data. We also compared different sentiment analysis methods to improve on results from a previous study and suggested new methods.
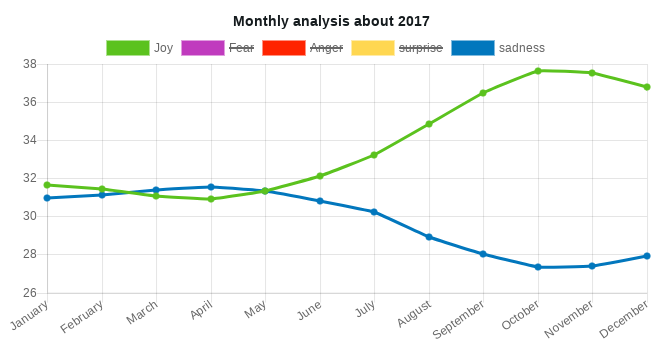
Monthly Results for Joy and Sadness in 2017
The full archive of 1.7 billion tweets, totaling 5.8 terabytes, came from Archive.org. These are JSON collections from Twitter’s general stream for research, history, testing, and archiving. This is the Spritzer version, the smallest Twitter data extract. We don’t have access to the larger Sprinkler or Garden Hose stream versions due to technical limits. Only English tweets were analyzed. Contact the uploader at jscott@archive.org for more info.
What We Learned
This study presented a sentiment analysis tool with a Web interface, using both archived data and real-time streams. Not having labeled data limited how much we could say the data was reliable.
A recent study pointed out software engineering limits, but didn’t look at what deep learning and neural networks could do. These keep getting better over time due to optimized functions and GPU power, as shown here.
Adding people’s locations from the real-time stream (see here) could let us make user-centered graphs and measure impact on an interactive map (example). This could show a person’s influence and more.
In summary, getting location data and making a strong neural network just for sentiment analysis could lead to exciting future work in this area.